All practical guides
Where not to live in Norfolk: what the 2025 data shows
Thirty-one Norfolk neighbourhoods are in England's most deprived tenth, mostly in Great Yarmouth and Norwich. Far more people live where you need a car for everything.

The government’s 2025 deprivation index puts 31 of Norfolk’s 552 neighbourhoods in England’s most deprived tenth. They sit in 17 wards in Great Yarmouth, Gorleston, Norwich, King’s Lynn and Thetford, and about 54,000 people live in them. The same index puts 184 Norfolk neighbourhoods, home to about 311,000 people, in England’s worst tenth for reaching shops, schools, a doctor and work without a car. For most people moving here the second list matters more. You can judge a street on a viewing. You can’t see from the pavement that the last bus leaves before you finish work.
Which Norfolk town fits you?
Six questions give you a shortlist of the Norfolk towns that fit your budget, schools, trains and how quiet you want it. The shortlist appears on the page straight away, with no email needed. Start with what you can spend on a home:
Up to £200,000Up to £260,000Up to £320,000Up to £400,000More than that
Renting, or would rather not give a figure? Start from the beginning with no price limit.
Neither list says a street is unsafe or unpleasant to live on. The index ranks areas against each other, not against a fixed standard, and the government’s own notes on it say every area holds people who are deprived and people who are not. Read it as a guide to which questions to ask, then go and look.
The neighbourhoods ranked most deprived
The index splits England into 33,755 neighbourhoods of about 1,500 people on average and ranks them on income, work, education, health, crime, access to housing and services, and the state of the housing and surroundings. Norfolk’s 31 in the bottom tenth fall like this:
- Great Yarmouth, 12. Five are in Nelson ward and four in Central and Northgate, with two in Southtown and Cobholm and one in Yarmouth North. The neighbourhood in Nelson ward that ranks 37th of 33,755 is the most deprived in Norfolk.
- Gorleston, 3. Two in Claydon ward and one in Magdalen.
- Norwich, 10. Three in Wensum ward, two each in Crome and Mile Cross, and one each in Catton Grove, Mancroft and Town Close. All ten are inside the city boundary; the suburbs in Broadland and South Norfolk have none.
- King’s Lynn, 5. Two in St Margaret’s with St Nicholas, and one each in North Lynn, Gaywood Clock and South and West Lynn.
- Thetford, 1, in Thetford Priory ward.
Great Yarmouth is the one town where the problem covers more than a few streets. Twelve of the 17 neighbourhoods in its built-up area are in the bottom tenth. Averaged across all 17, it ranks 16th most deprived of England’s 3,793 built-up areas. The government’s release names it among the ten districts where neighbourhoods deprived on many fronts are most concentrated: four of its 60 rank highly deprived on six or more of the seven measures, the sixth-highest share in England. Gorleston, across the river, is mixed: 3 of its 15 neighbourhoods are in the bottom tenth and 2 are in England’s less deprived half. Bradwell, next to it, has none in the bottom tenth and four of its six in the less deprived half.
| District | Neighbourhoods | In England’s most deprived tenth | District rank of 296 (1 is most deprived) | Recorded crimes per 1,000 people, year to June 2026 |
|---|---|---|---|---|
| Great Yarmouth (borough, including Gorleston) | 60 | 15 | 25th | 95.6 |
| Norwich | 85 | 10 | 64th | 108.3 |
| King’s Lynn and West Norfolk | 92 | 5 | 69th | 57.6 |
| North Norfolk | 62 | 0 | 89th | 43.1 |
| Breckland | 80 | 1 | 112th | 49.9 |
| South Norfolk | 88 | 0 | 220th | 41.8 |
| Broadland | 85 | 0 | 240th | 34.4 |
North Norfolk is the odd one in that table. It has no neighbourhood in the bottom tenth yet ranks as more deprived than Breckland, because its weak scores are spread across the district and not concentrated in a few streets. Its weakest measures are education and skills, where it ranks 32nd of 296, access to housing and services (33rd) and the condition of its housing and surroundings (49th).
Where crime is highest
Norwich has the highest recorded crime rate of the seven districts, 108.3 crimes per 1,000 people in the year to June 2026, excluding fraud. Great Yarmouth follows at 95.6. Both are above the rate for England and Wales, 84.6. These rates divide crimes by residents only, which ONS notes can overstate the rate where many visitors and workers come in, as they do to a city centre. Broadland, which takes in the city’s suburbs to the north and east, from Hellesdon round to Thorpe St Andrew, has the lowest at 34.4 (ONS). Norfolk as a whole recorded 61.2, the seventh-lowest of the 42 police force areas with a published rate.
The index’s crime measure goes down to the neighbourhood, using six years of recorded crime, 2018/19 to 2023/24, for violence, burglary, theft, criminal damage and public order offences, plus two years of anti-social behaviour reports. Thirty-three Norfolk neighbourhoods are in England’s worst tenth on it: 16 in Norwich, 9 in Great Yarmouth, 4 in King’s Lynn, 2 in Thetford, 1 in Gorleston and 1 in Cromer. Three of Norwich’s 16 are in Mancroft, the city centre ward, in the parts north of the market around Colegate, Anglia Square and Oak Street. The streets round the market, City Hall and the castle fall just outside the bottom tenth. The measure divides crime by residents plus people who work in the area, so visitors to a busy centre add to its crimes but not to the people they are divided among. Our safest places guide goes down to parish level.
Moving to Norfolk this year?
Get the free Norfolk Relocation Pack: all 46 towns we cover on one table, on price, council tax, population, trains and distance to Norwich, plus a week-by-week move checklist. The download appears here as soon as you enter your email.
Unsubscribe any time.
The longer list: places you will need a car
The 2025 index is the first to measure access by public transport, walking and cycling, in place of road distance. It works out the travel time to shops, schools, health services, work and leisure from each neighbourhood on a term-time weekday’s timetables, and it leaves the car out on purpose. On that measure 184 of Norfolk’s 552 neighbourhoods are in England’s worst tenth: 42 of 92 in King’s Lynn and West Norfolk, 38 of 88 in South Norfolk, 37 of 80 in Breckland, 31 of 62 in North Norfolk, 24 of 85 in Broadland, 12 of 60 in Great Yarmouth and none of Norwich’s 85.
Eighty-four of the 184 are spread across open country and small villages, too scattered for the ONS to match to any one built-up area. The rest include neighbourhoods in Belton, Martham, Ormesby St Margaret, Feltwell, Upwell and Outwell, and two of Watton’s seven. The larger market towns do better, but not well. Every neighbourhood in Cromer, Sheringham, Holt, Fakenham, North Walsham, Aylsham, Swaffham, Diss, Attleborough, Downham Market and Hunstanton sits in the less connected half of England.
This is where the two lists cross. Most of the county’s least deprived places are villages around Norwich. Of England’s 3,793 built-up areas, where 1st is the most deprived, Cringleford ranks 3,424th, Taverham and Drayton 3,296th, Poringland 3,240th, Mulbarton 3,217th, Hethersett 3,104th and Brundall 2,882nd. Every one of their neighbourhoods is in England’s less connected half. Thorpe End, a single neighbourhood east of the city and the least deprived built-up area in the county, is in England’s worst tenth for getting about without a car. Great Yarmouth, the most deprived town in the county, has 15 of its 17 in the better connected half. The quiet places are quiet partly because you drive to everything.
For a household with two drivers that is a running cost, and our pros and cons guide puts a figure on the second car. For anyone moving here to retire, it is the question to ask about the years when driving stops, and our guide to living on the coast without a car covers the places where that works.
How to check a street yourself
The government’s Local Deprivation Explorer takes a postcode and shows that neighbourhood’s ranks. Police.uk maps recorded crime month by month, each one placed on or near a street, which shows whether a high figure is one corner or the whole estate. For buses, look up the nearest stop on bustimes.org and read the times for the hour you would leave for work and the hour you would come back.
Then go twice, once on a weekday evening and once on a Saturday morning, and walk from the house to the nearest shop. The index measures the averages; only being there tells you what the street is like.
Questions people ask
What are the rough areas of Norfolk?
The government’s deprivation index doesn’t use the word and doesn’t say any street is unsafe, but the neighbourhoods it ranks most deprived are in Great Yarmouth (mostly Nelson and Central and Northgate wards), parts of Gorleston, Norwich (Wensum, Crome, Mile Cross and three other wards), King’s Lynn and one ward of Thetford. Thirty-one of Norfolk’s 552 neighbourhoods are in England’s most deprived tenth, and none of them is in North Norfolk, Broadland or South Norfolk.
Which areas in Norfolk are the most deprived?
Great Yarmouth. As a district it ranks 25th most deprived of England’s 296 on the 2025 index, and a neighbourhood in its Nelson ward ranks 37th of 33,755, the most deprived in Norfolk. Twelve of the 17 neighbourhoods in Great Yarmouth’s built-up area are in England’s most deprived tenth.
Which area in Norfolk has the highest crime rate?
Norwich, with 108.3 recorded crimes per 1,000 people in the year to June 2026, excluding fraud, followed by Great Yarmouth at 95.6. Broadland had the lowest, 34.4. The rate for England and Wales was 84.6 (ONS).
Is Norfolk a safe place to live?
By recorded crime it is safer than most of England and Wales: 61.2 crimes per 1,000 people in the year to June 2026, against 84.6 nationally, the seventh-lowest of the 42 police force areas with a published rate. Five of its seven districts are below the national rate; Norwich and Great Yarmouth are above it.
Where in Norfolk is hard to live without a car?
About a third of the county, nearly all of it outside Norwich and Great Yarmouth. On the 2025 index’s public transport measure, 184 of Norfolk’s 552 neighbourhoods are in England’s worst tenth, home to about 311,000 people, with the most in King’s Lynn and West Norfolk, South Norfolk, Breckland and North Norfolk. None of Norwich’s neighbourhoods is in that tenth.
Not sure which town yet? Answer six questions and get a shortlist of the Norfolk towns that fit your budget, schools, trains and how quiet you want it.
How we produced this guide
Deprivation figures are from the English Indices of Deprivation 2025, published by the Ministry of Housing, Communities and Local Government on 30 October 2025: neighbourhood ranks and deciles from File 7, district ranks (rank of average rank) from File 10, and built-up area ranks from File 15. Neighbourhoods are 2021 lower-layer super output areas, matched to 2025 wards and 2022 built-up areas with the ONS lookups; populations are the index’s mid-2022 denominators. The public transport measure is the Geographical Barriers sub-domain, which in 2025 uses the Department for Transport’s connectivity score in place of road distances; the technical report describes it and the crime measure. Recorded crime rates are from the ONS police force area data tables for the year ending June 2026, excluding fraud: table P3 for Norfolk and England and Wales, and table C4 for the districts, which uses an older population estimate. Last updated: 3 November 2026. Author: Tom Fletcher, Property and Relocation Editor.
Planning a move to Norfolk?
Our guides to hiring the firms a move needs.
We earn no commission on these links. Paid placements are sold separately and always labelled. See our advertising and disclosure page.
Keep reading

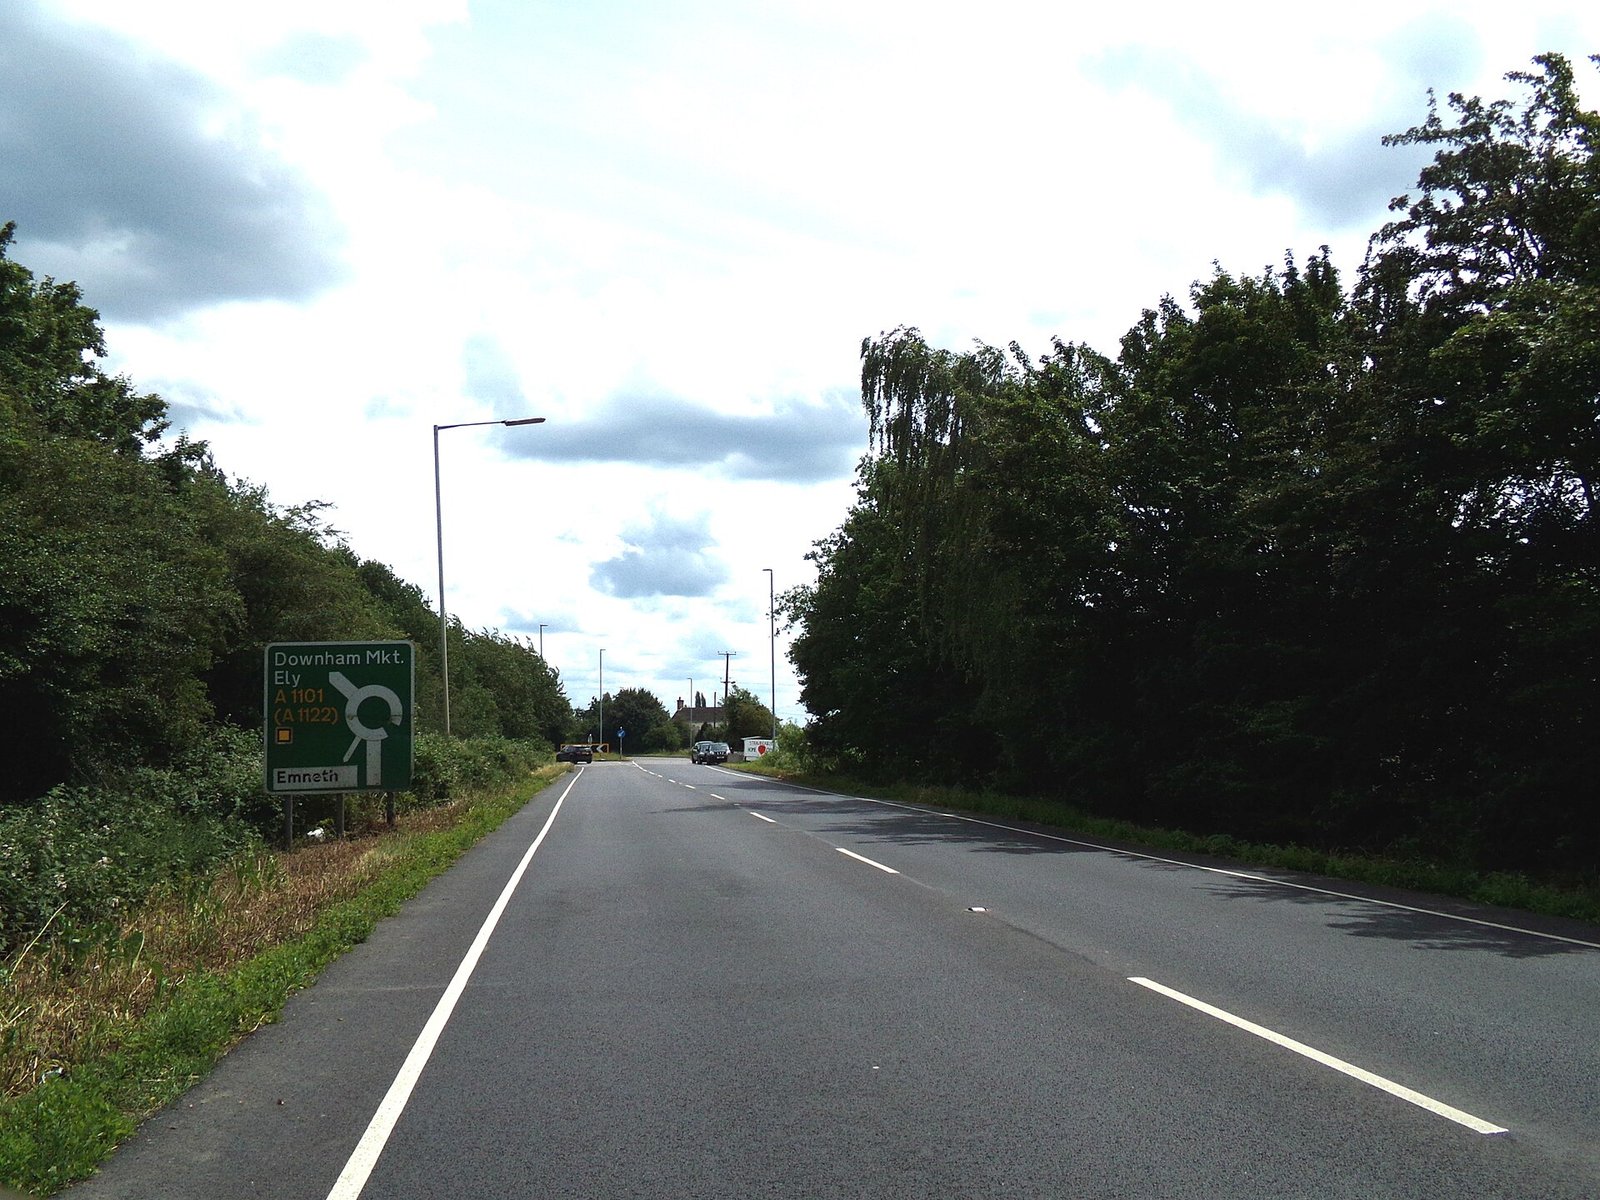
The A1101 at Outwell, one of the Fen villages the 2025 index ranks hard to get about without a car. Photo: Geographer via Geograph, CC BY-SA 2.0.