All practical guides
When to buy and sell a house in Norfolk: what the sales records show
Most Norfolk sales complete in the second half of the year, and in a normal year the official index climbs through the summer. Those prices were agreed months earlier, in winter and early spring.

In a normal year, Norfolk’s housing market runs to the same calendar. Leave out 2016, 2020 and 2021, when a stamp duty deadline or the lockdown bent the figures, and 11 years remain from 2011 to 2024. January and February held 13% of the county’s completed sales between them. July to October held 37%. The official price index for Norfolk rose in June, July and August in every one of those years. What the records don’t show is when those prices were agreed. Land Registry dates a sale by the day it completed. Rightmove’s figures from July 2026 put the average gap between agreeing a sale and completing it at 171 days in the East of England. On that average, most of the summer rise in the records is made of prices agreed in the winter and early spring before.
Two warnings go with that. Tax deadlines have moved more Norfolk sales than any season, and 2026 has broken the pattern: Norfolk’s index fell between May and August this year, for the first time since 2008.
Month by month, 2011 to 2024
The table leaves out 2016, 2020 and 2021. In those years a stamp duty change or the lockdown bent the figures. The first column is each month’s share of its year’s completed sales, averaged across the 11 years. The second is the average monthly change in the UK House Price Index for Norfolk. The index adjusts for the mix of homes sold, so a month heavy with detached houses doesn’t pass for a price rise.
| Month of completion | Share of the year’s sales | Average change in Norfolk’s price index | Years the index rose, of 11 |
|---|---|---|---|
| January | 6.5% | 0.0% | 6 |
| February | 6.5% | -0.2% | 4 |
| March | 7.8% | -0.3% | 4 |
| April | 7.2% | -0.1% | 7 |
| May | 8.0% | +0.4% | 7 |
| June | 8.5% | +0.6% | 11 |
| July | 9.0% | +0.9% | 11 |
| August | 9.8% | +0.7% | 11 |
| September | 8.6% | +0.7% | 9 |
| October | 9.5% | +0.3% | 7 |
| November | 9.4% | 0.0% | 4 |
| December | 9.1% | 0.0% | 4 |
January or February was the year’s quietest month in nine of the 11 years. The busiest was August in four years and October in three. The second half of the year took between 52% and 60% of the year’s sales every time. None of this is peculiar to Norfolk. England’s shares over the same years were 13.3% for January and February and 36.7% for July to October, against Norfolk’s 13.1% and 36.9%.
The records show when the keys changed hands
Land Registry’s price paid data gives each sale the date it completed, as stated on the transfer deed. The house price index is built from those registered sales. The price was agreed months earlier. Rightmove’s regional figures of July 2026 put the average East of England home at 66 days on the market before a buyer is found, then 171 days from sale agreed to completion: nearly eight months in all.
Run those averages forward from a house listed on 1 February 2027 and it would go under offer around 8 April and complete around 26 September. Run 171 days back from the June to August completions that lifted the index in every one of the 11 years, and those prices were agreed between about mid-December and mid-March. That is our arithmetic on an average with a wide spread around it. Rightmove’s figures are for 2026, and the gap in earlier years may have been shorter or longer, which would move these dates. Read it as a rough map.
Moving to Norfolk this year?
Get the free Norfolk Relocation Pack: all 46 towns we cover on one table, on price, council tax, population, trains and distance to Norwich, plus a week-by-week move checklist. The download appears here as soon as you enter your email.
Unsubscribe any time.
If you are selling
The table shows how the index moves each month, but what a seller gets is its level. Prices generally rise over time, so we measured each month against the average of the 12 months around it. On that measure, Norfolk’s year bottoms out with the April and May completions, after the late-winter dip and before the summer climb has got going. It peaks with September and October. The gap between the low and the high averages about 2%. On Norfolk’s average price in August 2026, £267,745, that is over £5,000. Both September and October stood above April in every one of the 11 years.
Run Rightmove’s averages back from those months. The September and October completions were agreed between about mid-March and mid-May, by houses that went on the market between about early January and early March. The April and May completions were agreed between about mid-October and mid-December, by houses listed between about early August and early October. That is the 1 February example above: a house listed then would, on the averages, complete in late September.
If you are selling one home and buying another in the same chain, most of this cancels out. Both prices are agreed in the same weeks. The calendar counts for people on one side of the trade only: someone selling to rent, to move in with family or to leave the county’s market altogether. Families have a second clock to work to, the school application dates, set out in our guide to moving to Norfolk with school-age children. What the sale itself costs is in our guide to the cost of selling a house in Norfolk.
If you are buying
Buyers get the other side of the same pattern. Offers agreed between about mid-October and mid-December have, on these averages, completed in April and May, the low point of Norfolk’s year once the general rise in prices is taken out. Before that low, the index fell in February in 6 of the 11 years and in March in 7. A sale agreed in the first week of November would, on Rightmove’s average, complete in late April.
The buyers who gain most are those with nothing to sell in the same season: first-time buyers, cash buyers and anyone renting while they look. The rest of the bill, stamp duty included, is in our guide to the cost of buying a house in Norfolk.
Tax deadlines move more sales than the seasons
Stamp duty is usually charged at the rates in force on the day a purchase completes, not the day contracts are exchanged. When stamp duty is about to rise, completions crowd into the last month before the change. Norfolk’s records show it at least three times:
- March 2016, before the higher rates for second homes and buy-to-let, 3 percentage points above the standard rates, started on 1 April. Norfolk had 2,321 sales that March and 928 in April.
- 2021, the year the temporary reduced rates stepped down at the end of June and ended at the end of September. June had 2,934 sales, September 2,535 and March, when the reduced rates were first due to end, 2,534. Those are the three busiest months for Norfolk in the index’s records, which start in 1995.
- March 2025, the last month before the point at which stamp duty starts fell from £250,000 to £125,000 on 1 April. Norfolk had 2,237 sales that March. April had 593, the fewest in any month since the lockdown of April 2020. Norfolk’s index fell 2.0% that month, its biggest one-month fall since February 2009. With so few sales, one month’s figure moves easily.
The 2025 deadline was worth at most £2,500 to anyone but a first-time buyer, for whom it could be worth more. That is less than the gap between the year’s low and high on an average Norfolk house. It nearly doubled March’s usual number of sales. The Budget on 28 October 2026 announced no change to the stamp duty rates people pay when they buy a home.
2026 has not followed the pattern
On the first estimates, Norfolk’s index fell 0.9% between May and August 2026. It rose over those months in every year from 2009 to 2025, by between 0.6% (2019) and 3.8% (2014). The last fall over those months was in 2008. England’s rose 0.2%, its smallest summer rise in that time. Norfolk’s average price in August 2026 was £267,745, a little below the £268,217 of August 2025.
These are early figures. A sale reaches the index only once it is registered, which Land Registry says usually takes two weeks to two months after completion. The latest months are revised as more sales arrive. The averages above describe past years. This summer shows they aren’t a promise. District prices and how they have moved this year are in our guide to Norfolk house prices and our report on the first half of 2026.
District by district
The calendar is the same across the county. North Norfolk completes 37.6% of its sales between July and October; the city of Norwich completes 37.0%. The districts differ in how far the index moves over the summer. It rose most in King’s Lynn and West Norfolk and in Great Yarmouth, 3.1% on average between May and August, and least in Norwich and South Norfolk, 1.8%. A district index rests on fewer sales and swings more from month to month, as the index’s own notes say. Read the last two columns as a tendency.
| Area | Share of sales in January and February | Share of sales, July to October | Average index change, May to August | Years it rose May to August, of 11 |
|---|---|---|---|---|
| Breckland | 13.0% | 36.9% | +2.0% | 8 |
| Broadland | 12.4% | 37.5% | +2.4% | 9 |
| Great Yarmouth | 13.4% | 36.7% | +3.1% | 11 |
| King’s Lynn and West Norfolk | 13.9% | 37.3% | +3.1% | 11 |
| North Norfolk | 13.1% | 37.6% | +2.3% | 11 |
| Norwich | 13.6% | 37.0% | +1.8% | 10 |
| South Norfolk | 12.4% | 35.7% | +1.8% | 8 |
| Norfolk | 13.1% | 36.9% | +2.3% | 11 |
| England | 13.3% | 36.7% | +2.5% | 11 |
Questions people ask
What is the best month to sell a house in Norfolk?
On the averages, a house on the market between about January and early March. Measured against the general rise in prices, Norfolk’s index peaks with September and October completions, and on Rightmove’s 2026 averages for the East of England, 66 days to find a buyer and 171 to complete, those sales went on the market early in the year. It is arithmetic on averages, and Norfolk’s fall in the summer of 2026 shows it is no promise.
When do most houses sell in Norfolk?
In the second half of the year. Across the 11 normal years from 2011 to 2024, July to December took between 52% and 60% of Norfolk’s completed sales, and July to October alone took 37%. January and February are the quietest months, with 13% between them.
When is the best time to buy a house in Norfolk?
For a buyer with nothing to sell, agreeing a price in late autumn. On the averages, sales agreed between about mid-October and mid-December complete in April and May, the low point of Norfolk’s year once the general rise in prices is taken out. In a chain, the season affects your sale and your purchase alike, so most of it cancels out.
How long does it take to sell a house in Norfolk?
Rightmove’s figures of July 2026 for the East of England are 66 days to find a buyer and 171 days from sale agreed to completion, nearly eight months in all. Its release gives regions, not counties.
How we produced this guide
Monthly sales counts and price changes are from HM Land Registry’s UK House Price Index for Norfolk, its seven districts and England, January 1995 to August 2026. We took them from Land Registry’s linked data service on 4 November 2026. Sales counts are market-value sales by month of completion. They run to June 2026 and the latest months are incomplete, so the averages use whole years only. The 11 years are 2011 to 2015, 2017 to 2019 and 2022 to 2024. Smaller deadlines fall inside them, such as the end of first-time buyers’ stamp duty relief in March 2012, and those years stay in. Shares are each month’s sales as a percentage of its calendar year’s, averaged across the 11 years. Monthly changes are the index’s published figures, averaged. The May to August changes are calculated from the index levels, except 2026’s, which uses the average price because the published index is rounded to one decimal place (on the rounded index it is 0.8%). The low and high points of the year compare each month’s index with a centred 12-month moving average (the 13 months around it, the two outer months at half weight), averaged across the 11 years. Times to sell and complete are from Rightmove’s regional release “North-South divide for time to move as Londoners see longest wait”, reported on 31 July 2026 and read on 4 November 2026. The dates worked forward and back from them are our arithmetic. The completion date and the registration lag are from HM Land Registry’s guide to the price paid data. Stamp duty dates and rates are from GOV.UK: HMRC’s guidance on the temporary reduced rates of 2020 and 2021, the policy paper on higher rates for additional properties, the policy paper on the temporary increase to the thresholds, the current residential rates page and the Budget 2026 document. Last updated: 4 November 2026. Author: Tom Fletcher, Property and Relocation Editor.
Planning a move to Norfolk?
Our guides to hiring the firms a move needs.
We earn no commission on these links. Paid placements are sold separately and always labelled. See our advertising and disclosure page.
Keep reading


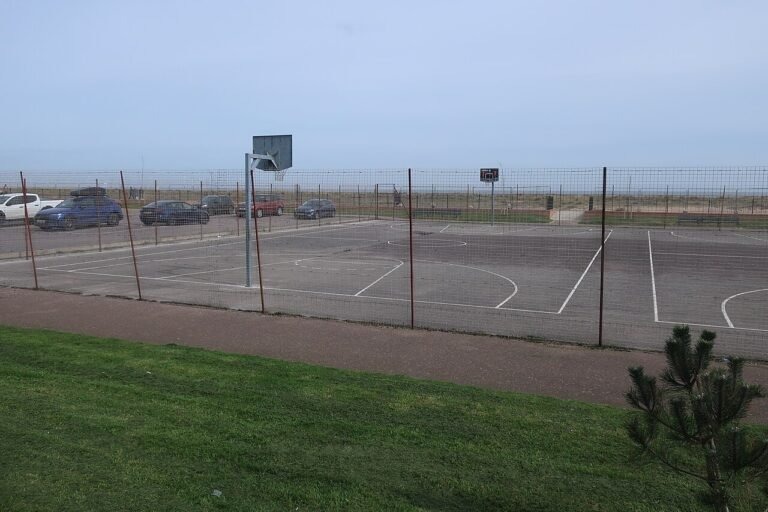
A red-brick terrace on Earlham Road, Norwich, in July 2024. Photo: David Howard via Geograph, CC BY-SA 2.0.