All practical guides
Norfolk cost of living: housing, council tax, cars and heating
Moving to Norfolk saves money on housing and very little else. Council tax is higher than in London, most households run two cars and one home in six is heated by oil.

Moving to Norfolk saves you money on housing and on very little else. The average home cost £269,185 in July 2026 on the UK House Price Index, about half the London figure and a little under the UK average. Council tax is higher than in London, most households run two cars, one home in six is heated by oil, and full-time pay is about £2,400 a year below the England median.
House prices
Norfolk is priced about level with the UK as a whole. In July 2026 the county’s average of £269,185 was £3,426 under the UK figure and up 0.7% on a year earlier. The large gaps are with London and Cambridge. Suffolk is about £11,500 dearer.
| Area | Average price, July 2026 |
|---|---|
| London | £550,037 |
| Cambridge | £475,151 |
| England | £293,479 |
| Suffolk | £280,742 |
| UK | £272,611 |
| Norfolk | £269,185 |
Inside the county the district averages run from £209,114 in Great Yarmouth to £313,407 in Broadland, the ring of suburbs and villages north and east of Norwich. South Norfolk is close behind Broadland. Norwich itself is the second cheapest district; four in ten of its homes are in council tax Band A, the lowest. The full figures are in the district table below.
District averages hide the top of the market. On HM Land Registry’s sales records for the year to June 2026, the median price was £415,000 in Wells-next-the-Sea, against £140,000 in Great Yarmouth. Burnham Market has too few sales for a one-year figure; over the three years to June 2026 its median was £715,000. Holt was £335,000. The H1 2026 house-price report has the figure for each of the 46 places we cover, and our north Norfolk coast vs Norwich suburbs comparison sets the two ends side by side. For what is on the market now, see Rightmove or Zoopla.
The cheapest towns by median sale price were Great Yarmouth, then King’s Lynn and Gorleston (£190,000 each) and Thetford (£218,750). Dereham was £240,000, Attleborough £255,000 and Downham Market £260,000.
Prices, rents and council tax by district
| District | Average price, July 2026 | Average rent, August 2026 | Three-bed rent | Band D before parish precept, 2026-27 |
|---|---|---|---|---|
| Broadland | £313,407 | £938 | £1,078 | £2,323.08 |
| South Norfolk (Wymondham, Diss) | £311,587 | £981 | £1,107 | £2,368.17 |
| North Norfolk (Holt, Wells, Fakenham) | £292,563 | £865 | £1,002 | £2,366.82 |
| Breckland (Thetford, Dereham, Attleborough, Swaffham) | £268,905 | £928 | £1,044 | £2,311.65 |
| King’s Lynn and West Norfolk | £265,715 | £941 | £1,053 | £2,345.61 |
| Norwich | £224,323 | £1,142 | £1,137 | £2,503.43 |
| Great Yarmouth | £209,114 | £841 | £933 | £2,386.42 |
The council tax column is the county, police and district shares added together, before any town or parish precept.
Moving to Norfolk this year?
Get the free Norfolk Relocation Pack: all 46 towns we cover on one table, on price, council tax, population, trains and distance to Norwich, plus a week-by-week move checklist. The download appears here as soon as you enter your email.
Unsubscribe any time.
Renting
Rent is where the saving over London is largest. The ONS average private rent in London was £2,332 a month in August 2026 and £1,459 across England. In Norfolk it ran from £841 in Great Yarmouth to £1,142 in Norwich. A one-bedroom home in Norwich averaged £778.
Norwich rents barely moved in the year to August 2026, while Great Yarmouth’s rose 7.6%, from £781 to £841. On the coast, holiday lets and second homes take a share of the housing out of the year-round market: North Norfolk District Council’s 2022 count found 34.8% of homes in Wells-next-the-Sea were one or the other. Our guide to renting in Norfolk covers the rest.
Council tax
Council tax is higher in Norfolk than in London. The average Band D bill for 2026-27 was £2,068 across London and £2,392 across England, and Norfolk bills sit around the England figure. Every Norfolk district starts at £2,311.65 or more before any parish precept, because Norfolk County Council takes £1,843.38 and the police £344.79 of every Band D bill.
Norwich has no parish councils, so its £2,503.43 is the whole bill. Elsewhere the town or parish precept goes on top, and it varies. In Wymondham it adds £114.25 at Band D. In Aylsham it adds £227.68, taking the bill to £2,550.76, the highest in Broadland. Fakenham’s £2,685.72 is the highest in North Norfolk. Parts of Great Yarmouth borough, Gorleston among them, have no parish council either. Check the parish before you buy; our Norfolk council tax guide lists them.
Second homes cost double. North Norfolk, King’s Lynn and West Norfolk, Great Yarmouth and Norwich have charged a 100% premium on furnished second homes since 1 April 2025, using powers in the Levelling-up and Regeneration Act 2023 (North Norfolk’s explanation). Breckland added one from April 2026. South Norfolk approved one in March 2025 but has not published a start date, and Broadland’s council tax pages show none. Our second homes guide has the detail.
Cars
Most Norfolk households need a car, and many need two. At the 2021 Census, 40.4% of Norfolk households had two or more cars or vans, against 35.2% across England and 17.6% in London. Only 17.4% had none. Outside Norwich and the towns with a station, such as Wymondham, Diss, Thetford and King’s Lynn, the train is not a daily option. Our commuting guide covers the routes that work.
Small-town shopping adds miles. Holt’s weekly shop is a Budgens on Kerridge Way; the nearest large supermarkets are the Tesco in Sheringham and the Morrisons in Fakenham. Norwich has all the big chains.
Heating
Far more Norfolk homes heat with oil than homes elsewhere. At the 2021 Census, 17.3% of Norfolk homes were heated by oil alone, against 3.2% across England and 0.1% in London. In King’s Lynn and West Norfolk it was 25.1%, and in North Norfolk 24.6%. In Norwich it was 0.2%.
Heating oil is bought by the tank and the price moves with crude. BoilerJuice’s average kerosene price was 117.14p a litre on 24 September 2026, so a 1,000-litre delivery cost about £1,171. The Nottingham Energy Partnership’s September 2026 comparison put heat from kerosene at 11.02p a kWh, against 7.86p from mains gas. Our oil heating guide covers tanks and buying schemes, and the £9,000 heat pump grant for oil-heated homes runs to 31 March 2027.
Other costs to budget for
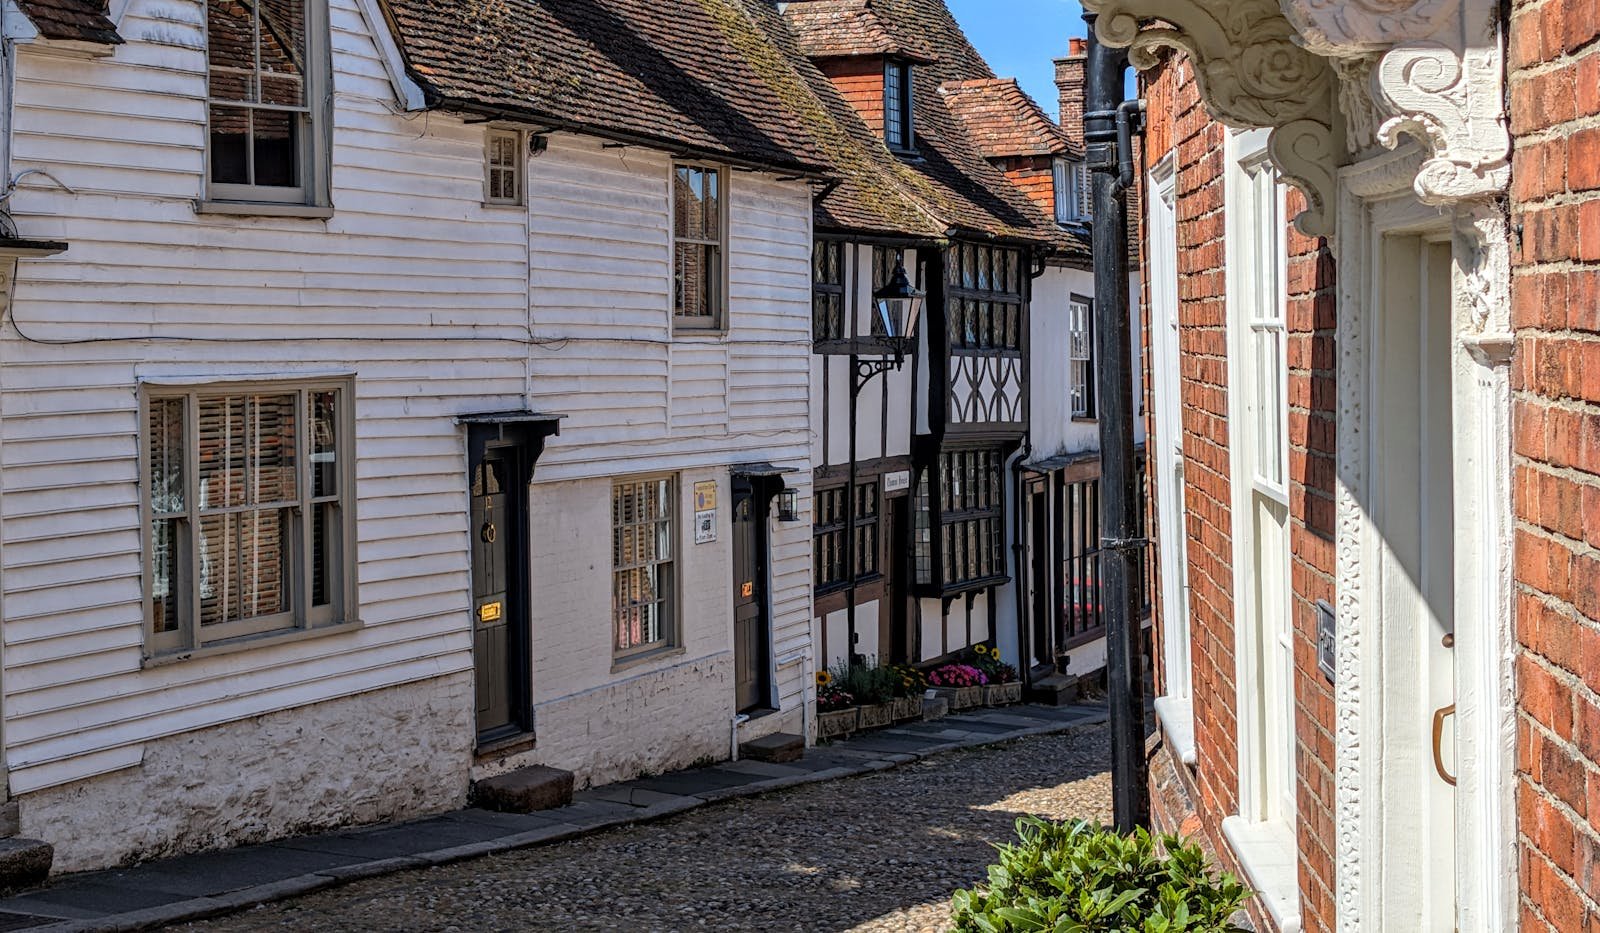
Old houses need money spent on them. Flint walls, reed thatch, sash windows and solid walls with no insulation all need regular work that a new-build does not. Get a survey that matches the building; our surveys guide explains the levels.
Parts of the Broads, the low-lying coast and some streets near the Wensum in Norwich are at flood risk, and that shows up in insurance premiums. Flood Re, the scheme that caps the flood part of premiums, covers only homes built before 1 January 2009, so a newer house on a flood-risk plot gets no help from it. Check the Environment Agency’s flood risk service for the address before you offer, and see our Norfolk flood risk guide.
Full fibre reached 84% of premises in Broadland and 77% in South Norfolk by September 2026, on thinkbroadband’s figures, but some villages are still on slower lines. Check the exact address on Ofcom’s checker before you commit; our broadband guide explains what to look for. Compare energy, insurance and broadband deals on MoneySuperMarket once you have an address.
Look up NHS dentists before you move. The NHS Find a dentist service shows which practices are taking new NHS patients. An NHS check-up is £27.90 (Band 1); private fees are set by each practice.
Pay
Wages are lower. The median full-time Norfolk resident earned £36,886 in 2025, against £39,243 across England and £46,414 in London (ONS earnings survey). Jobs based in Norfolk paid a median £35,940. A household bringing a London or Cambridge salary gains most from the move. A household earning Norfolk wages keeps the cheaper housing but pays the car, oil and council tax costs at the county’s rates.
Norfolk, England and London compared
| Measure | Norfolk | England | London |
|---|---|---|---|
| Average private rent, August 2026 | £841 to £1,142 by district | £1,459 | £2,332 |
| Band D council tax, 2026-27 | £2,311.65 to £2,503.43 before parish precepts | £2,392 average | £2,068 average |
| Median full-time pay, residents, 2025 | £36,886 | £39,243 | £46,414 |
| Households with two or more cars, 2021 | 40.4% | 35.2% | 17.6% |
| Homes heated by oil only, 2021 | 17.3% | 3.2% | 0.1% |
Take a family renting in London who move to a three-bedroom home in Wymondham, where trains reach Norwich in 13 to 16 minutes. South Norfolk’s average three-bedroom rent was £1,107 in August 2026. London’s average rent, across all sizes of home, was £2,332. Against that saving, their council tax goes up and a second car probably comes in.
Frequently asked questions
Is Norfolk expensive to live in?
Housing costs less than in London and the South East; rent in particular is less than half the London average. Council tax is higher than in London, most households need two cars, and oil heating costs more than gas.
What is the average house price in Norfolk?
£269,185 in July 2026 on the UK House Price Index, up 0.7% on a year earlier. District averages run from £209,114 in Great Yarmouth to £313,407 in Broadland. Town guides such as Thetford‘s give local sale prices.
How does Norfolk compare to Suffolk or Cambridgeshire for cost of living?
Suffolk’s July 2026 average was £280,742, about £11,500 above Norfolk. Cambridgeshire’s was £339,095 and the city of Cambridge’s £475,151. Pay is lower in Norfolk than the England median.
What are the most affordable places to live in Norfolk?
By median sale price in the 12 months to June 2026: Great Yarmouth (£140,000), King’s Lynn and Gorleston (£190,000 each) and Thetford (£218,750). Dereham (£240,000), Attleborough and Downham Market follow. Our guide to the most affordable places ranks them.
Related guides
- Is Norfolk a good place to live?
- Best affordable places to live in Norfolk
- First-time buyers guide
- Commuting from Norfolk
- Retiring to Norfolk
- Best Norfolk market towns
- Safest places to live in Norfolk
Plan the move
How we produced this guide
County, district and regional prices are from the HM Land Registry UK House Price Index, July 2026 release, published on 16 September 2026; the latest months are provisional. Town medians are from HM Land Registry Price Paid Data, standard sales in the 12 months to June 2026. Rents are the ONS private rent averages for August 2026, from the ONS release of 16 September 2026. Pay is the ONS Annual Survey of Hours and Earnings 2025 (median gross annual pay for full-time workers). Car ownership and central heating are from the ONS 2021 Census. Council tax is from the MHCLG 2026-27 statistics and each district council’s 2026-27 charges. Heating costs are from BoilerJuice and the Nottingham Energy Partnership, checked on 24 September 2026. See our methodology page for source links.
Data sources: HM Land Registry, ONS, MHCLG, Norfolk district councils, BoilerJuice. Prices to July 2026; council tax 2026-27. Last updated: 24 September 2026. Author: James Ward, Property and Money Editor.
Last reviewed
Planning a move to Norfolk?
Our guides to hiring the firms a move needs.
We earn no commission on these links. Paid placements are sold separately and always labelled. See our advertising and disclosure page.